Asha for Education
Asha Dallas is one of the 66 chapters of Asha for Education, a fully volunteer-run non-profit organization whose mission is to catalyze socio-economic change in India through the education of underprivileged children. It comprises of dedicated individuals primarily from the Dallas area, striving to make a difference to the society.We are driven by the belief that education is one of the primary factors in shaping a child’s future and by extension, future of the entire country. Asha works towards promoting the education of underprivileged children in India by providing financial assistance, guidance and support to NGOs focused on educational projects. The Dallas chapter currently supports 11 different projects across different parts of India.
Learn more by joining us at our meetings
Time: Every other Sunday, starting at 2:30 pm
Venue: University of Texas Dallas, Room ECSS 3.910
Join our mailing lists to get Asha updates
asha-dallas-members – Moderated (~2-3/week),
Meeting agenda/minutes and events are announced here! Non-members can request access to this list to be more involved
To keep up with latest updates about Asha Dallas :
- Like our facebook page
Updates
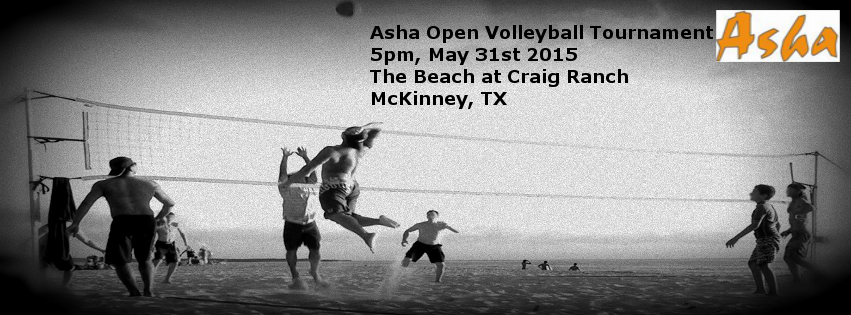 Click on the slide for more tournament and registration details.